Menu

Feedback Loop Diagram

Design how insights flow back from operations to drive continuous improvement, learning, and adaptation.

O-G-OPS-FLD

Feedback Loop Diagram

Design how insights flow back from operations to drive continuous improvement, learning, and adaptation.

O-G-OPS-FLD

Feedback Loop Diagram

Design how insights flow back from operations to drive continuous improvement, learning, and adaptation.

O-G-OPS-FLD

Introduction

Feedback loops close the gap between design and reality. They ensure the organization learns from operational experience and adapts accordingly.

Phase

Guide

Lens

Operations

Purpose

Design continuous improvement mechanisms
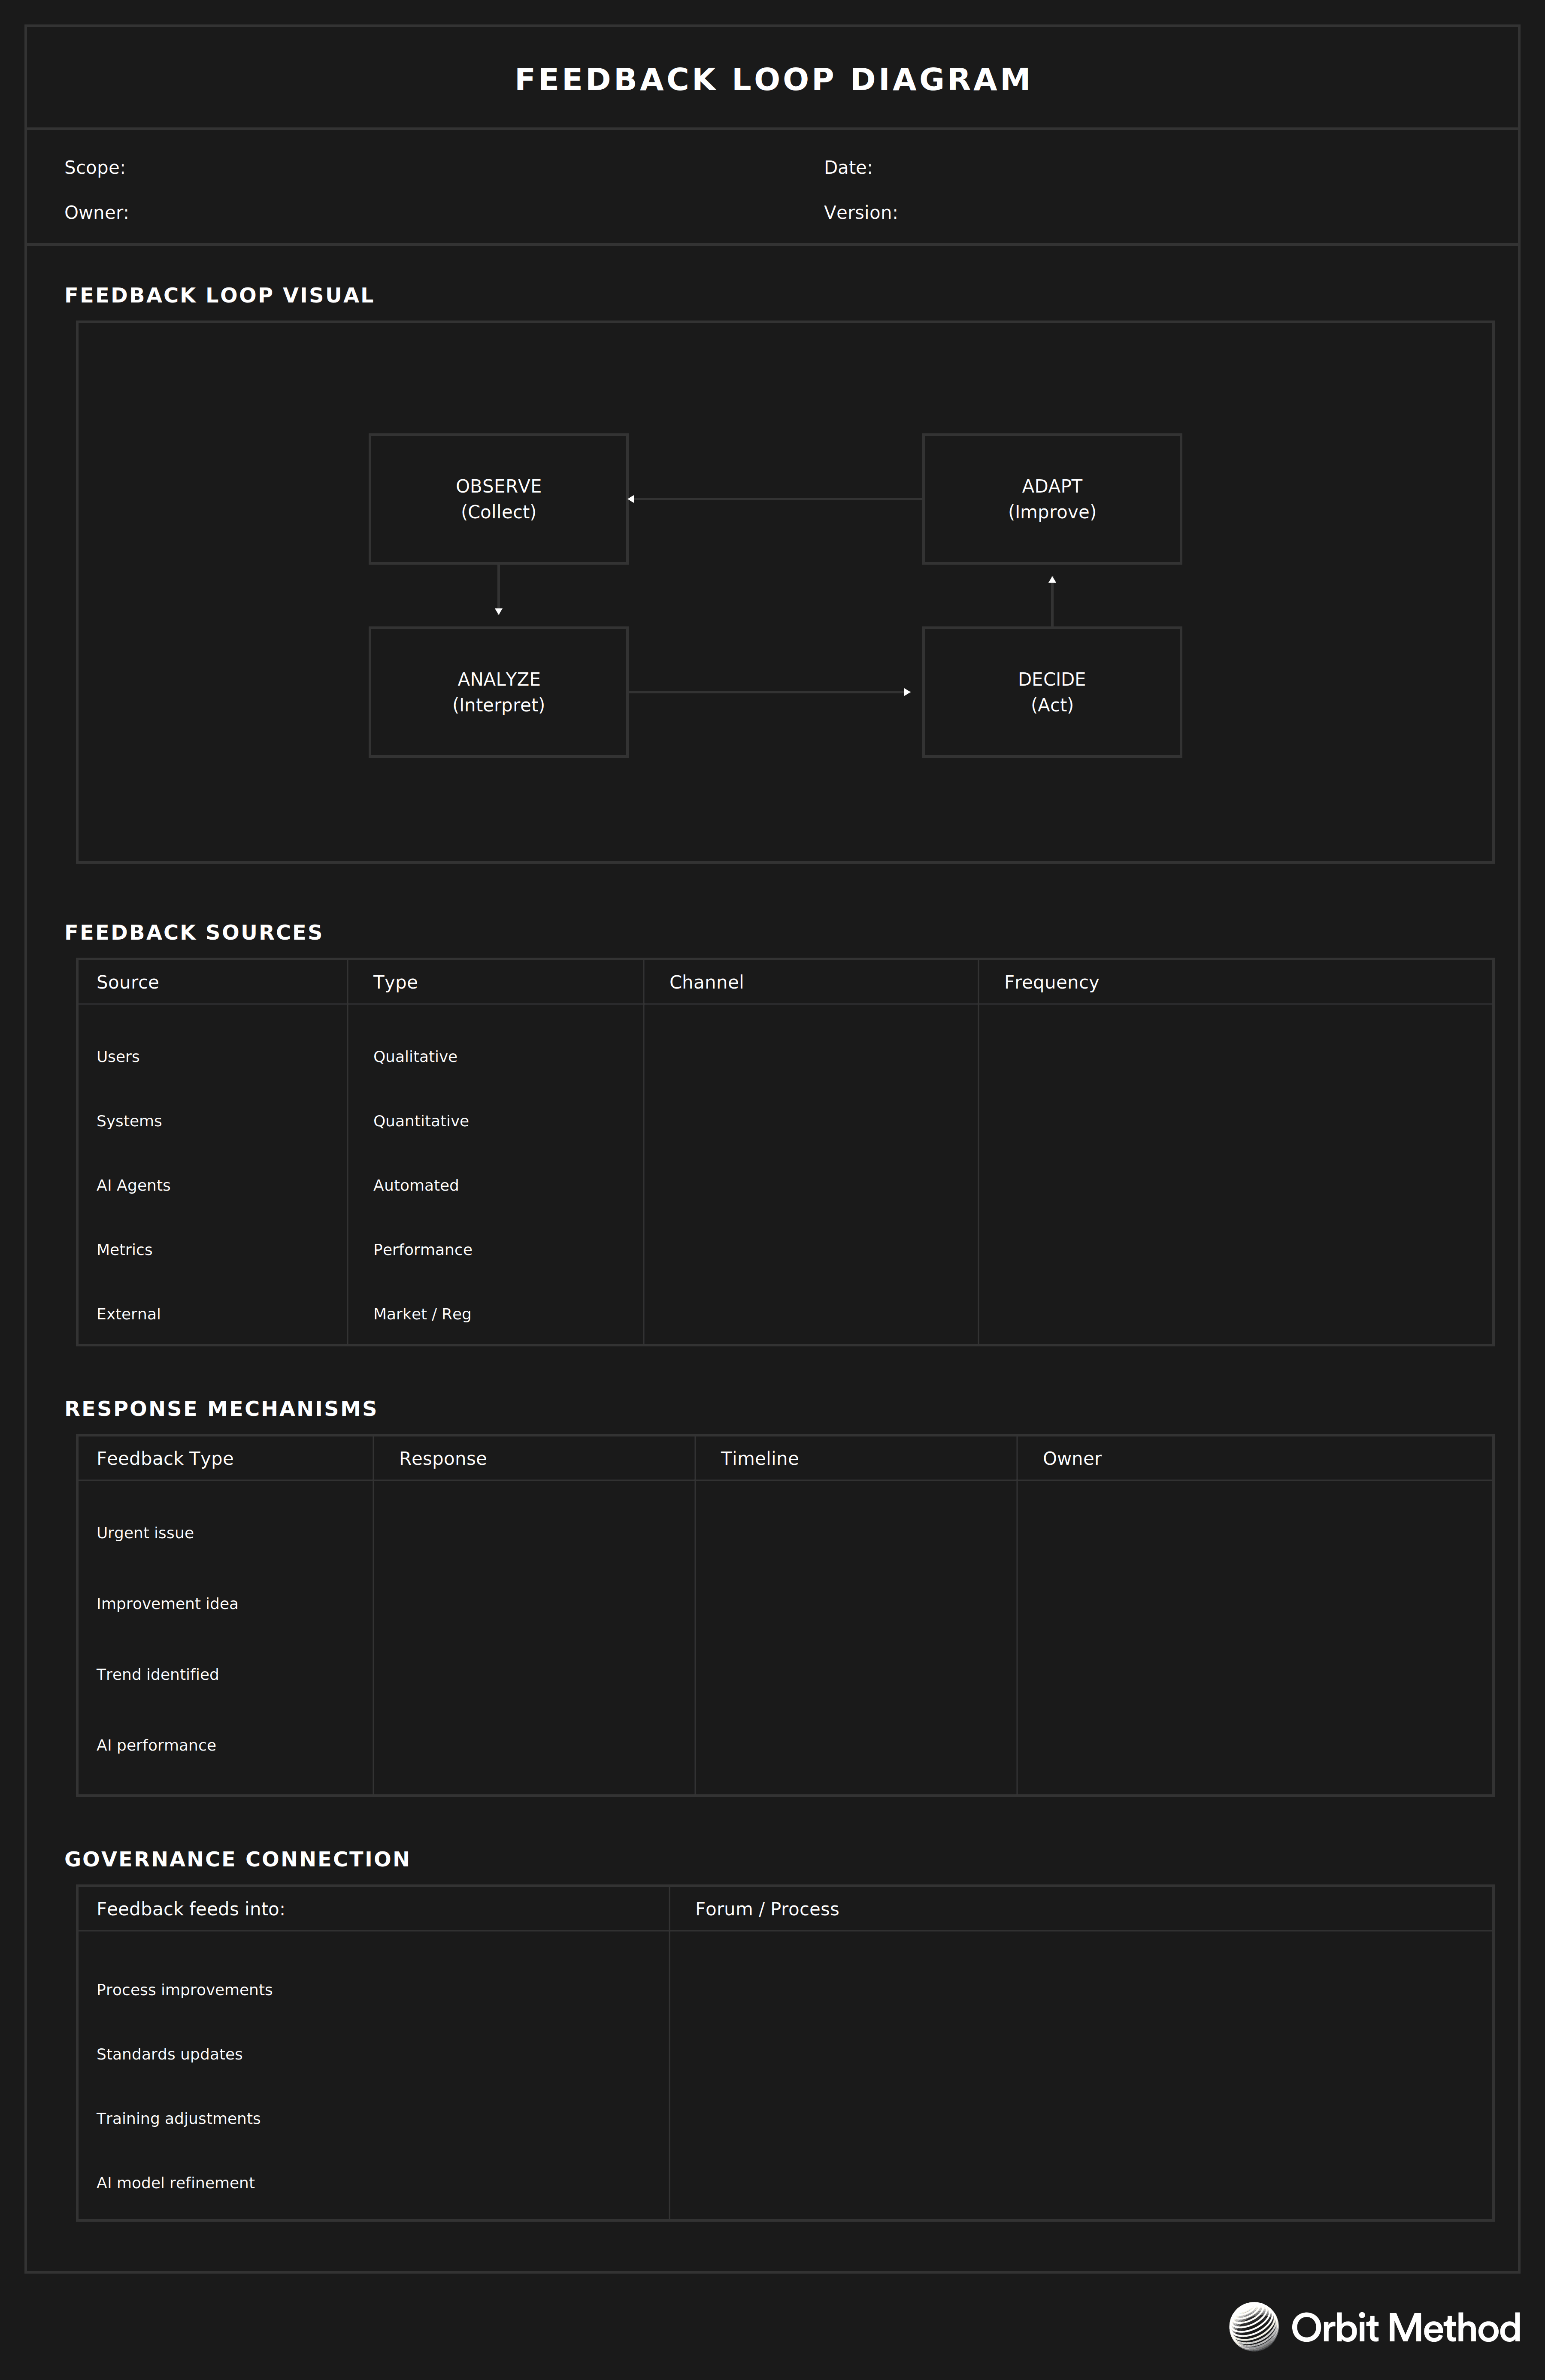
Output

Feedback Loop Diagram

Who's Involved

Process owners, analytics team, continuous improvement team

Duration

2-3 hours

Steps

  1. Identify key feedback sources (users, systems, metrics)

  2. Define feedback channels and collection methods

  3. Design response mechanisms and routing

  4. Assign ownership for action and follow-through

  5. Connect feedback to governance and decision-making

  6. Establish closure and communication of outcomes

Template

Continue reading

Looking to contribute?

Orbit evolves through practice. Whether you're applying the method, testing ideas, or finding gaps, your experience helps refine it. Share what you're learning and help shape the next update.

Looking to contribute?

Orbit evolves through practice. Whether you're applying the method, testing ideas, or finding gaps, your experience helps refine it. Share what you're learning and help shape the next update.

Looking to contribute?

Orbit evolves through practice. Whether you're applying the method, testing ideas, or finding gaps, your experience helps refine it. Share what you're learning and help shape the next update.

©2026 Orbit Method™

By Cognitive Superiority

©2026 Orbit Method™

By Cognitive Superiority

©2026 Orbit Method™

By Cognitive Superiority