
Introduction
Process redesign only matters if it delivers results. This dashboard monitors how transformed processes are actually performing, enabling continuous optimization and rapid response to issues.
Phase | Evolve |
Lens | Operations |
Purpose | Monitor process performance in production |
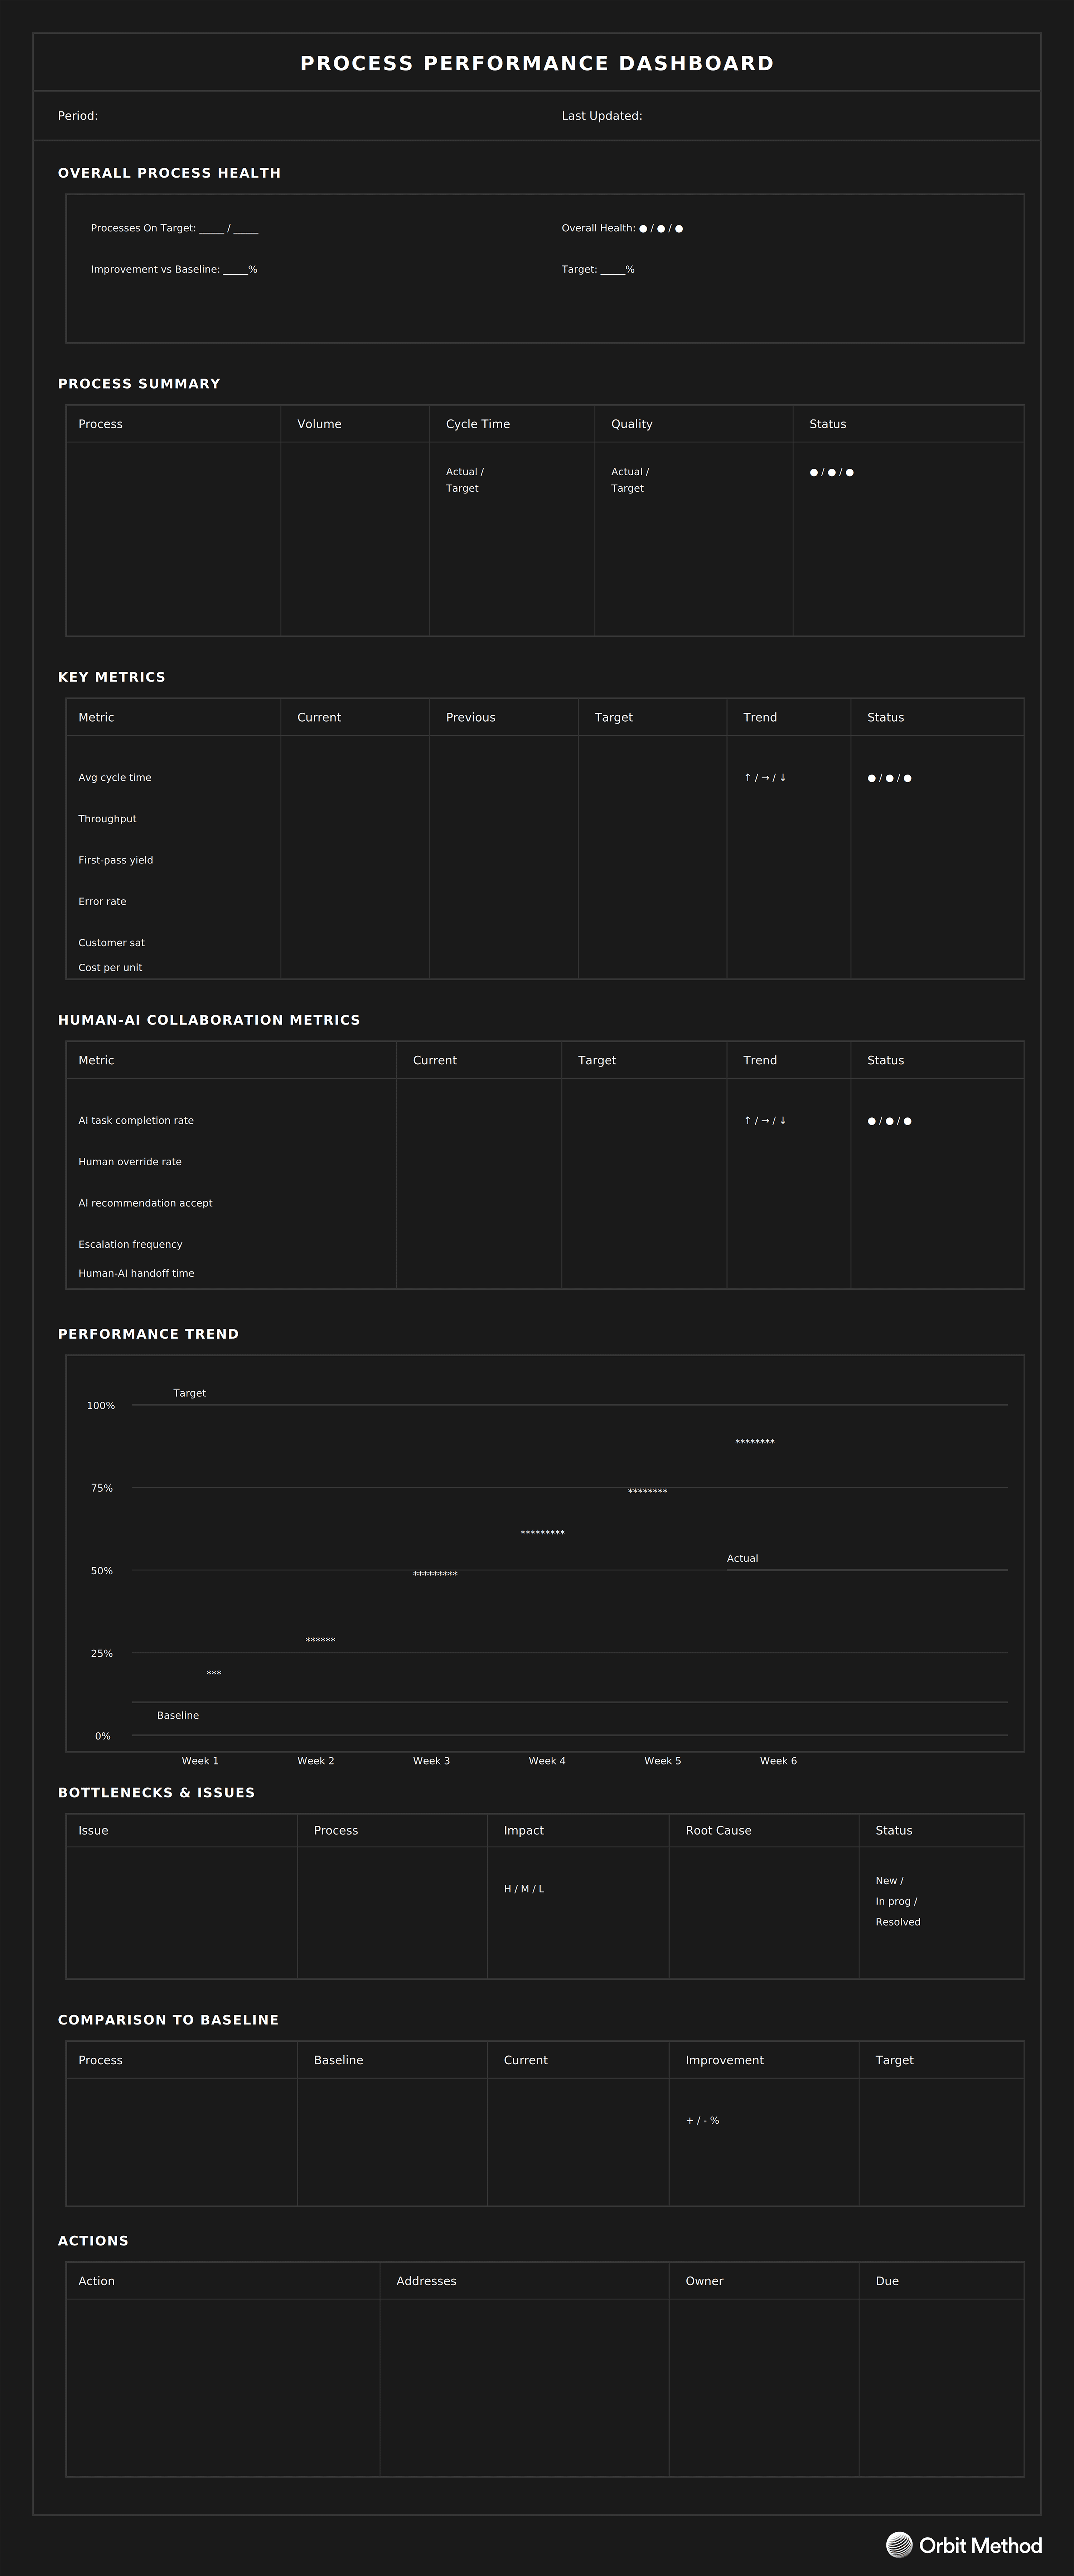
Output | Process Performance Dashboard |
Who's Involved | Process owners, operations, analytics, continuous improvement |
Duration | 2-4 hours for design; ongoing operation |
Steps
Define key performance indicators for each process
Identify data sources and collection mechanisms
Set targets, baselines, and thresholds
Design dashboard layout and visualizations
Create drill-down capabilities for investigation
Establish review cadence and response protocols
Template
Continue reading
Looking to contribute?
Orbit evolves through practice. Whether you're applying the method, testing ideas, or finding gaps, your experience helps refine it. Share what you're learning and help shape the next update.